מרצים המעוניינים לצפות בנתוני צפייה בווידיאו בקורסים שלהם מוזמנים לפנות אלינו לקבלת הרשאות מתאימות.
מצ"ב הוראות צפייה:
To access the video analytics offered in Panopto click on the stats button for the video you are interested in.
This will bring up a new window displaying the analytics of that video.
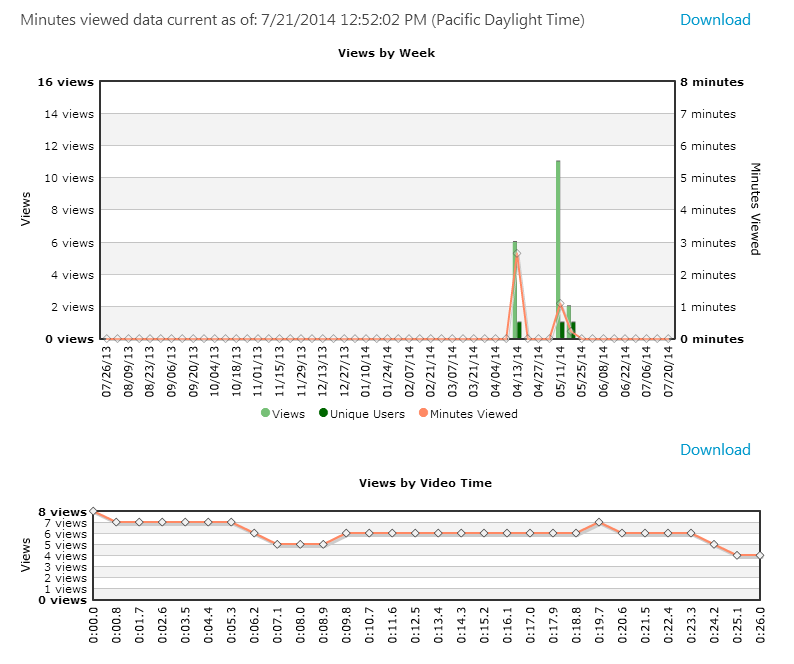
Initially the time frame for the graphs will be set to the past 30 days. To change this you can selete a new time frame from the links below the graphs.
![]()
- The first chart displays the number of unique viewers as well as total views with the green bar graphs, arranged by time. It also shows the average time spent on the video for each view.
The second chart shows how many views a particular segment of the video had. This can be useful to see if a significant number of viewers are skipping a section of the video.
At the bottom of the video analytics window is a list of the viewers with the number of views each one of them has had for that video and the total time spent viewing.

(מתוך https://www.uwb.edu/learningtech/panopto/panopto-for-faculty/video-analytics)